


Executive Summary
During the past few years, the landscape for U.S. renewable diesel production has drastically changed, akin to the growth of ethanol and biodiesel during the past two decades. Driven by federal and state policies aimed at reducing emissions, this dramatic U.S. renewable diesel production and capacity growth is causing significant, market-altering shifts both domestically and to foreign feedstock trade. Renewable diesel, like biodiesel, is produced from the same renewable feedstocks such as vegetable oils, animal fats, or used cooking oil (UCO). The difference is that renewable diesel is produced using a hydrogen treatment which makes it chemically equivalent to petroleum diesel and can therefore be blended at higher levels and transported using existing pipelines.
As a result, the United States is rapidly expanding imports of animal fats and vegetable oils to both use as feedstocks for renewable diesel production and to backfill other feedstocks, like soybean oil, that have been diverted to renewable diesel production. Domestically, U.S. soybean crush expanded to produce more oil, driven by high soybean oil prices fueling strong crush margins. While domestic demand grew, U.S. soybean exports declined on expanding Brazilian supplies and slowing growth of global import demand. Additionally, U.S. soybean oil premiums rocketed so far above global vegetable oil prices that U.S. exports plummeted, and the United States became a net soybean oil importer for the first time in 2023. Higher soybean crush is driving the opposite for meal exports, as an abundance of soybean meal, combined with drought in Argentina – the world’s largest soybean meal exporter – has boosted exports with the potential for continued growth. While many wildcards could affect the U.S. biofuel, animal fats, and oilseed markets, renewable diesel production is anticipated to continue to grow and alter feedstock markets. The rate of production growth, however, will be highly dependent on federal and state policies, availability of feedstocks, and sustained U.S soybean meal export gains.
The Renewable Diesel Production Boom
The drastic expansion of renewable diesel production during the past few years is policy driven. Demand for renewable diesel is propelled by the carbon-emission reductions that it provides relative to petroleum diesel, and unlike biodiesel, can be used as a substitute for petroleum diesel rather than limited to blending at low levels. Petroleum diesel and renewable diesel are not the same, but they are so similar and substitutable that they compete on an energy-adjusted price (petroleum diesel has a slightly higher energy content). The production cost of renewable diesel is significantly higher, however, leading to a sizeable premium over petroleum diesel. Thus, without federal and state carbon-reduction policies mandating minimum quantities and providing tax credits, there would not be a market for renewable diesel production.
From a federal standpoint, there are two main policies incentivizing the production of biomass-based diesel, which includes both renewable diesel and biodiesel. The first is the Blender’s Tax Credit, which provides tax relief for blending biomass-based diesel into the U.S. diesel pool. This partially offsets the higher production cost of biomass-based diesel and helps to narrow the premium over petroleum diesel. The second federal policy is the Renewable Fuel Standard (RFS). This policy creates a mandated minimum for biofuels, such as biomass-based diesel, Sustainable Aviation Fuel (SAF), and ethanol, that need to be blended into the total U.S. fuel pool.
While these federal laws are incentivizing the growth of biofuels, the real driver for renewable diesel expansion has been the California Low-Carbon Fuel Standard (LCFS). Like the blender’s credit, this policy offsets higher biomass-based diesel production costs through a carbon credit for meeting emission targets and has driven renewable diesel consumption in California. Since California had already reached blending maximums for both ethanol (10 percent of gasoline pool) and biodiesel (5 percent of diesel pool), blenders needed to utilize other carbon-emission-reducing alternatives such as blending more renewable diesel, using more SAF, or lowering the carbon emissions of producing and blending existing biofuel consumption. As a result, renewable diesel expanded as it doesn’t have a blending ceiling like biodiesel and ethanol, and because of an influx of private investment to increase production capacities spurred by the long-term demand stability for biofuels created by the LCFS.
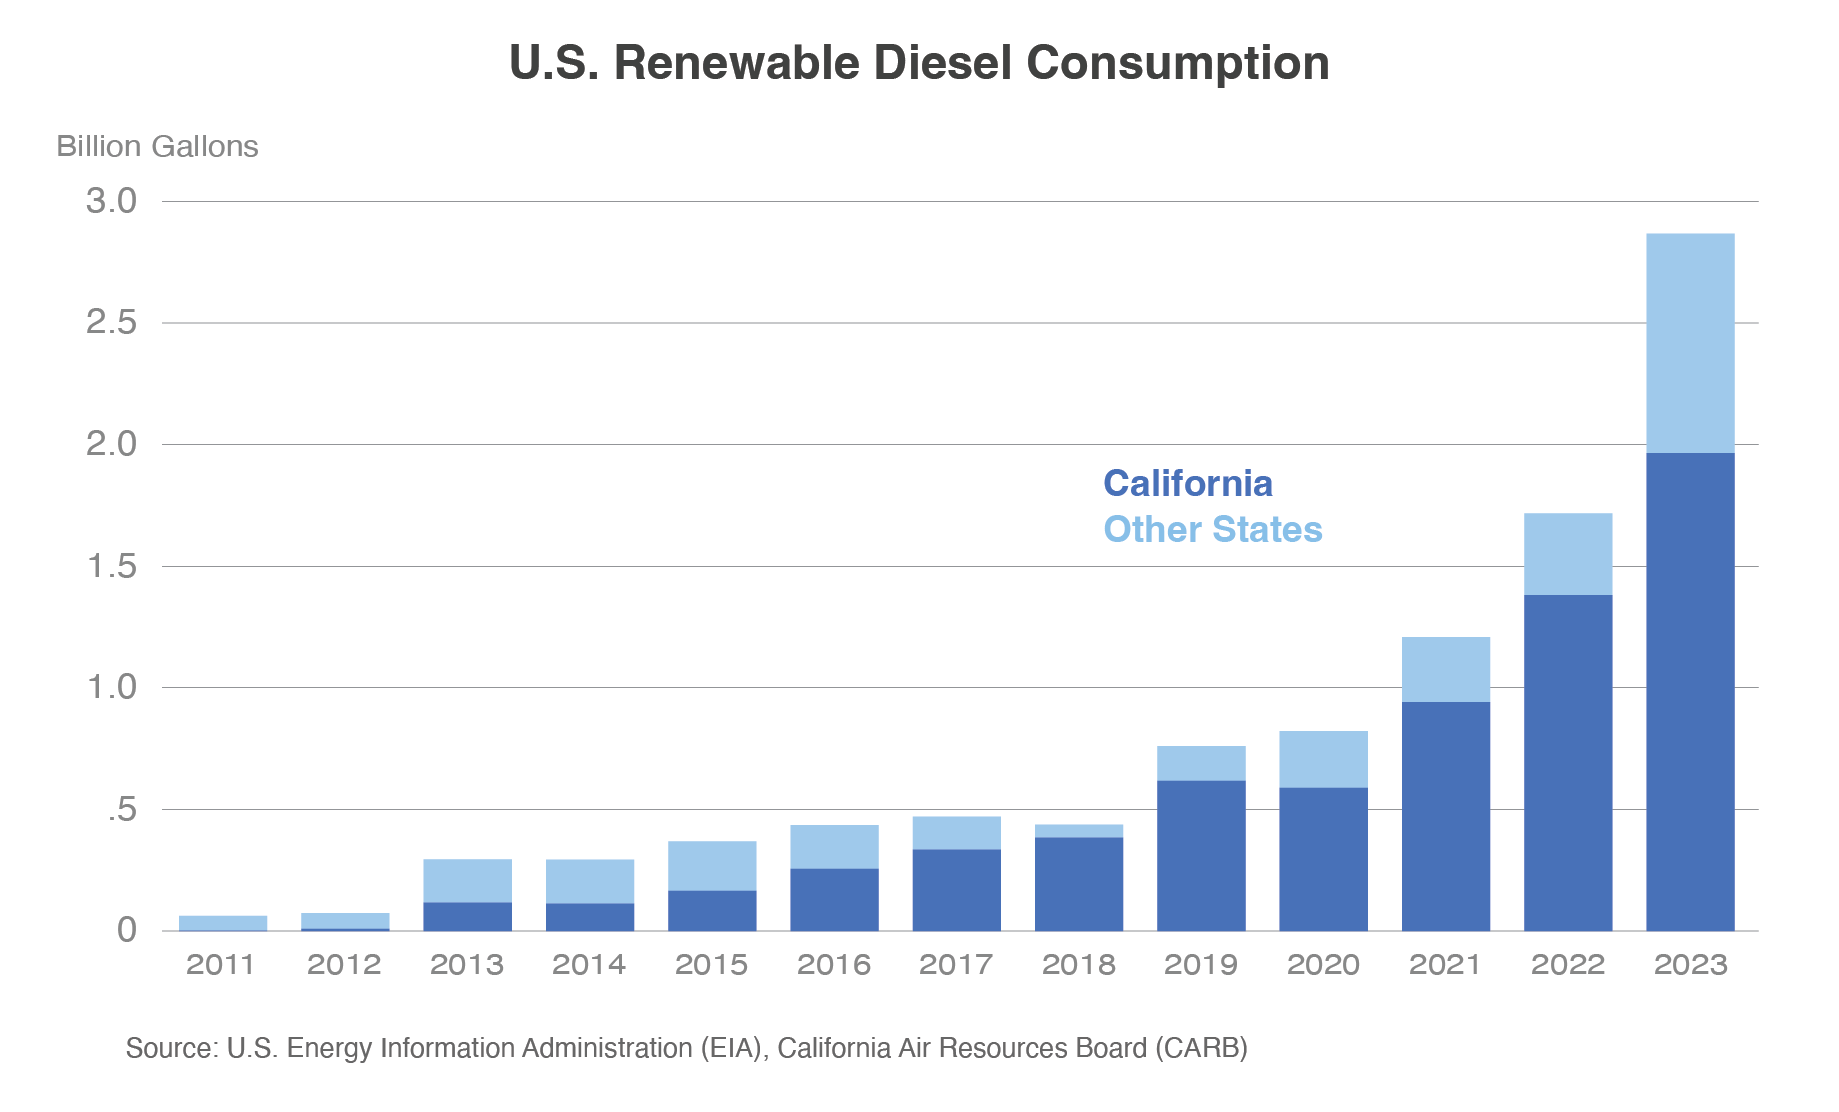
While the RFS sets a national mandate for biofuel consumption, the LCFS created a strong financial incentive that pulled most of the renewable diesel volume to the California market. Between 2020 and 2023, growth in California consumption was more than double the consumption growth throughout the rest of the United States. As a result, biomass-based diesel accounts for about 60 percent of the California diesel pool while the rest of the United States remains in the low single digits. While Oregon and Washington have similar state policies to the LCFS, California is the largest-consuming and fastest-growing state and is responsible for driving the meteoric ramp-up of renewable diesel capacity and production.
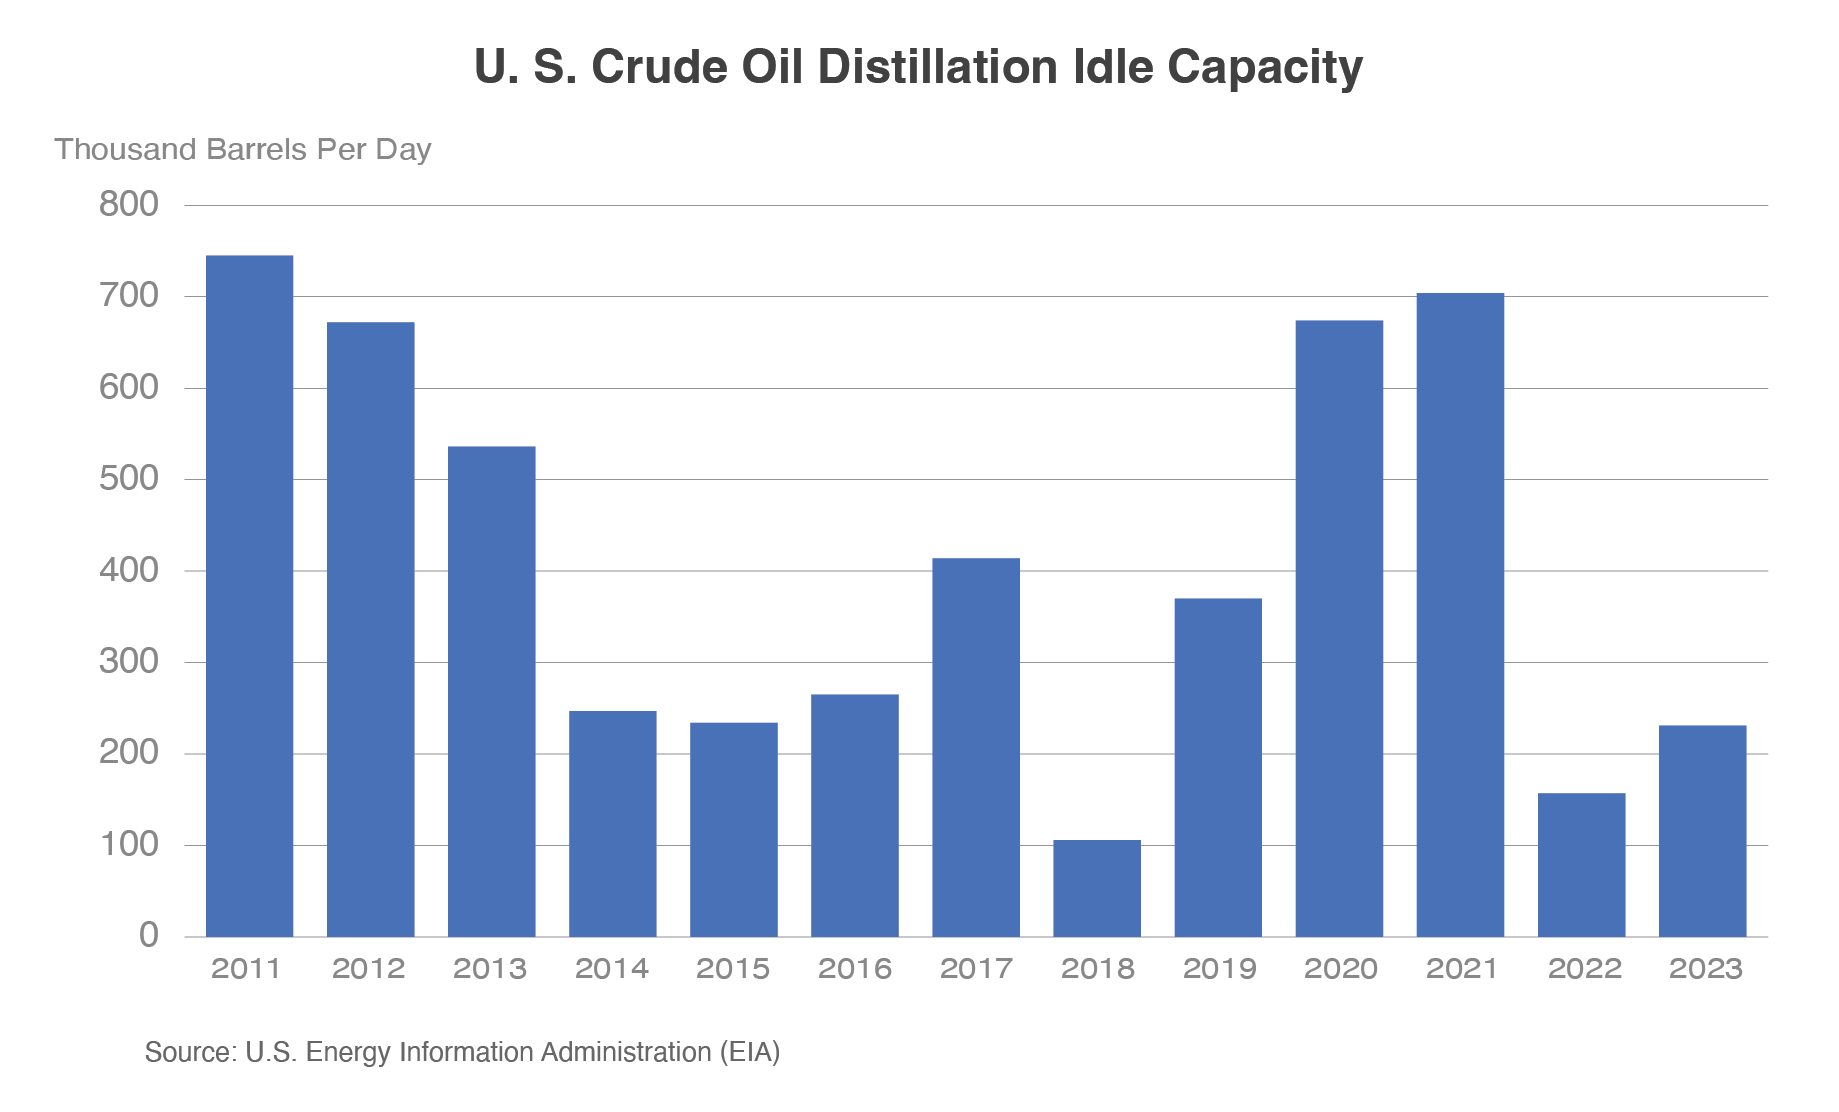
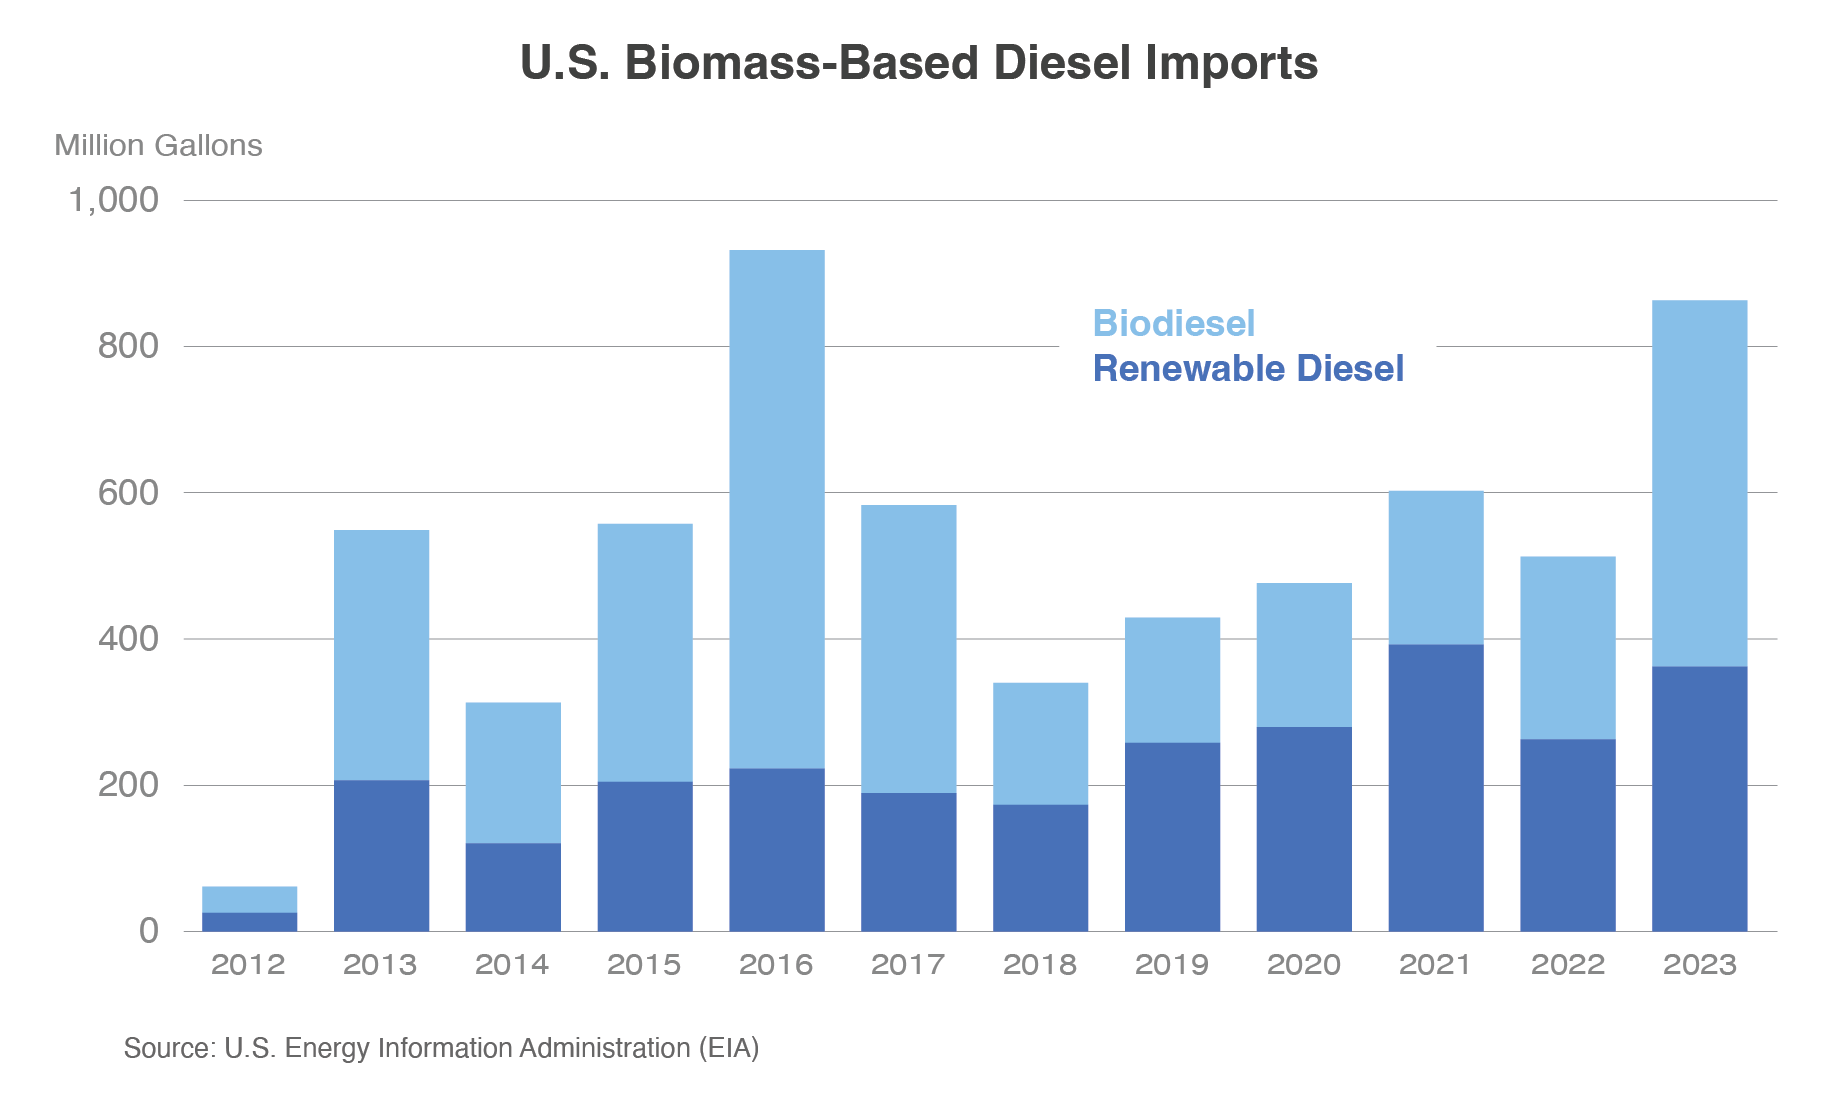
Lastly, key market factors have helped aid the expansion of renewable diesel production during the past few years. First, the process and equipment needed to make renewable diesel (and SAF) is like that used to make petroleum diesel. This allowed companies to convert part, or all, of a few existing refineries from producing fuel from petroleum into making renewable diesel and SAF from animal fats, vegetable oils, and hydrogen. Many of the decisions and announcements to repurpose refineries for renewable diesel came in 2020 and 2021, when idle capacity at petroleum refineries hit decade-highs due to COVID-19 impacting oil consumption and prices. This also coincided with the industry’s gradual transition from crude oil petroleum companies to energy companies through investments in alternative energy sources. Additionally, renewable diesel was able to expand quickly at the expense of biodiesel, as the two compete for the same feedstocks. As production of renewable diesel has expanded, biodiesel has gradually trended the opposite direction since peaking in 2018. In fact, U.S. renewable diesel production capacity surpassed biodiesel in July 2022, which led to renewable diesel production exceeding biodiesel in 2023.
Strong U.S. Demand for Fats and Oils Leads to Increased Imports
The explosion of renewable diesel capacity and production has significantly bolstered U.S. demand for feedstocks such as fats and oils. As a result, U.S. imports of vegetable oils and animal fats have exploded.
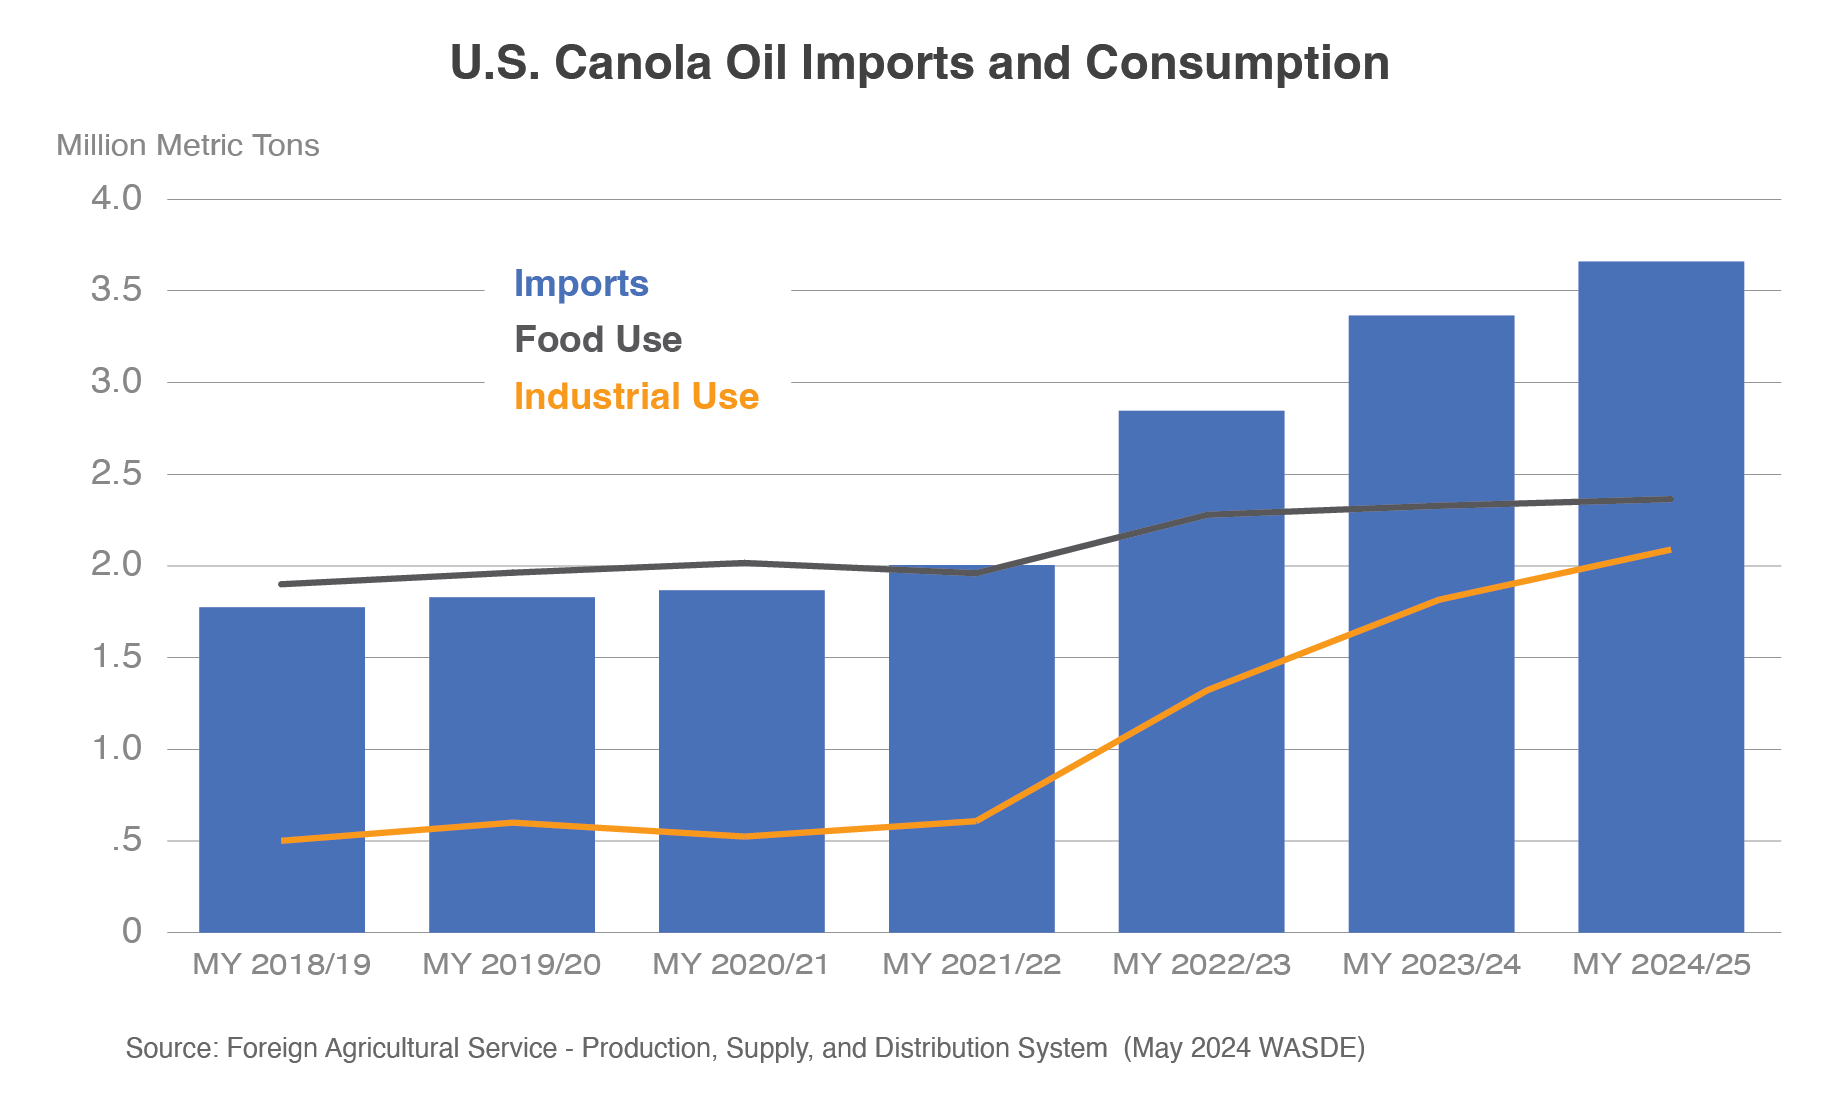
For example, canola oil imports surged during the past two years as a direct result of expanding renewable diesel production and policy changes. In December 2022, the Environmental Protection Agency announced that canola oil meets the RFS requirements to be used as a feedstock for renewable diesel. As a result, U.S. canola oil imports jumped to a record. While most of this demand was for biomass-based diesel production, some of the increased supplies were used for food, backfilling the displaced soybean oil that had been rerouted to produce renewable diesel. This is unlikely to be a short-term spike, as U.S canola oil imports, food use consumption, and industrial consumption are all forecast to be records for the third consecutive year in 2024/25. With a free trade agreement and geographical proximity to Canada, the world’s largest canola/rapeseed oil exporter, the United States will continue to have access to ample supplies. During the past few years, the United States has jumped from accounting for 50-60 percent of Canada canola oil exports to 91 percent in 2023. Additionally, canola oil supplies should remain robust as Canada announced plans to expand crush capacities in the next several years.
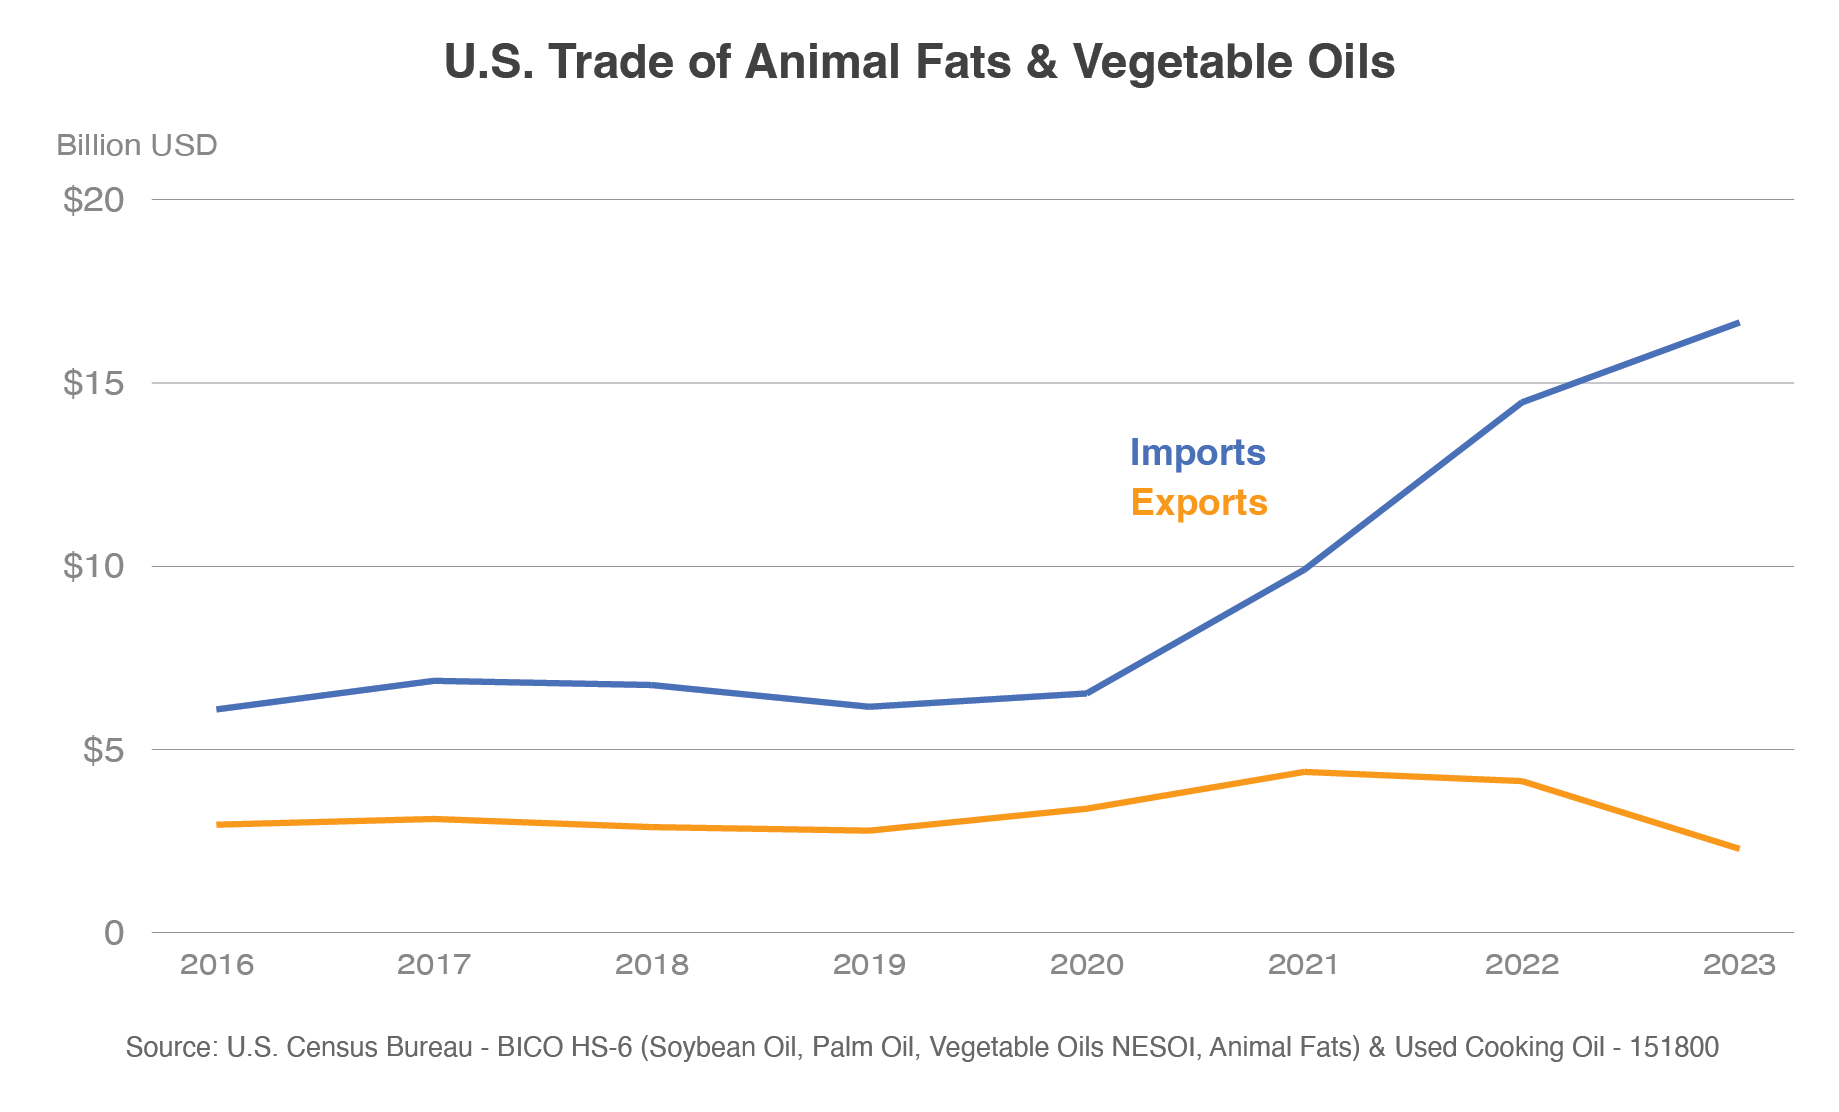
Canola oil provides a clear example of how U.S. import demand can spike as a direct result of renewable diesel expansion, but this trend is not unique and rather representative of many other inputs. In 2022, the main feedstocks for renewable diesel were yellow grease, soybean oil, corn oil, tallow, and canola oil. As expected, the collective imports for animal fats and vegetable oils have grown drastically in alignment with the growth of renewable diesel. In fact, U.S. import values of all animal fats and vegetable oils more than doubled from 2020 to 2023. One of the major drivers was UCO imports, which more than tripled in 2023 on higher imports from China.
U.S. imports of animal fats and vegetable oils should continue to grow in tandem with biomass-based diesel production, but it will get an additional policy bump next year. Starting in January 2025, the federal government will transition from a blender’s credit to a producer’s credit. Therefore, the tax credit will only apply to biomass-based diesel that is produced in the United States. Thus, demand for biofuel imports is expected to drop substantially, driving even greater imports of fats and oils to U.S. refineries to produce these biofuels domestically. During the past 5 years (2019-2023), biomass-based diesel imports averaged about one-fifth of production volumes, signaling a substantial opportunity for a bump in feedstock demand next year, further boosting a trade deficit that has been rapidly expanding.
Additionally, the Producer’s Tax Credit, coupled with the California LCFS, will heighten the demand for lower carbon-intensity feedstocks like tallow, UCO, and corn oil. Under the LCFS, west-coast market demand is stronger for feedstocks that provide greater carbon-emission reductions than virgin vegetable oils like canola and soybean oil. These policies will continue to pull available global feedstocks into the California renewable diesel market, and boost U.S. import demand for feedstocks that make lower carbon-intensity biofuels that generate additional credits in the California market.
Increased Domestic Demand Stimulates Crush and Suppresses Soybean Oil Exports
The boom in renewable diesel production has not only altered traditional import patterns, but U.S. agricultural export market dynamics are experiencing drastic shifts too. Firstly, U.S. soybean exports have trended downward since reaching a record in marketing year 2020/21. While U.S. soybean exports are forecast higher in 2024/25, U.S. share of global soybean trade is expected to remain below the 5-year average. The largest force dampening U.S. soybean exports is greater competition from Brazil, which is forecast to increase its soybean area harvested for 18 consecutive years in 2024/25. Due to a lack of storage capacity, Brazil prices beans at a discount to U.S.-origin soybeans after the South American harvest to ensure supplies are cleared out before next year’s crop. Increasing Brazilian production means larger supplies to compete with U.S. soybean exports during the typical selling window after the U.S. harvest.
Secondly, the decline in U.S. exports is partly due to reduced demand growth in China. The combination of animal disease, slowing economic growth, and efforts to reduce soybean meal usage have dampened Chinese import growth well below average rates during the past two decades. As a result of slower growth and increased Brazilian competition, the United States has lost market share in China since 2020/21. Additionally, economic issues and trade barriers reduced import demand for U.S. soybeans in Egypt, Pakistan, and Bangladesh. While much smaller than China, collectively these markets represented 10 percent of U.S. soybean exports 2021/22. In 2022/23, however, U.S. soybean exports to these countries plummeted by 4.0 million tons to just a three-percent share of U.S. exports.

Renewable diesel growth, however, is partially offsetting falling exports by stimulating domestic soybean consumption. In 2024/25, U.S. soybean crush is forecast at a record for the fourth consecutive year. This is a direct effect of expanding renewable diesel production as high domestic soybean oil prices have elevated crush margins. As a result, domestic crush is growing and helping to offset the shrinking U.S. share of global exports as South American supplies continue expanding.
Additionally, U.S. soybean oil exports have been drastically impacted by renewable diesel expansion. The main factor being the significant U.S. price premium above South American-origin soybean oil, which has rendered U.S. exports uncompetitive. The sudden spike in U.S. demand for soybean oil created a scarcity in the domestic market, pushing the price U.S. buyers were willing to pay well above competitors’ prices in South America. After the initial renewable diesel boom in 2021, U.S. soybean oil exports fell by 80 percent and have not recovered. The drop in exports was so significant that the United States became a net importer of soybean oil (tonnage-basis) in 2023 for the first time ever. In fact, the price discrepancy was so massive that the United States did not experience an uptick in soybean oil exports in 2022/23 despite a drought slashing soybean production in Argentina, the world’s largest soybean oil exporter. Owing to the drought, 2022/23 Argentina soybean oil production hit the lowest level in more than a decade, causing global importers to turn to Brazil for soybean oil and other lower-cost alternatives such as sunflowerseed oil and palm oil to offset the shortfall.
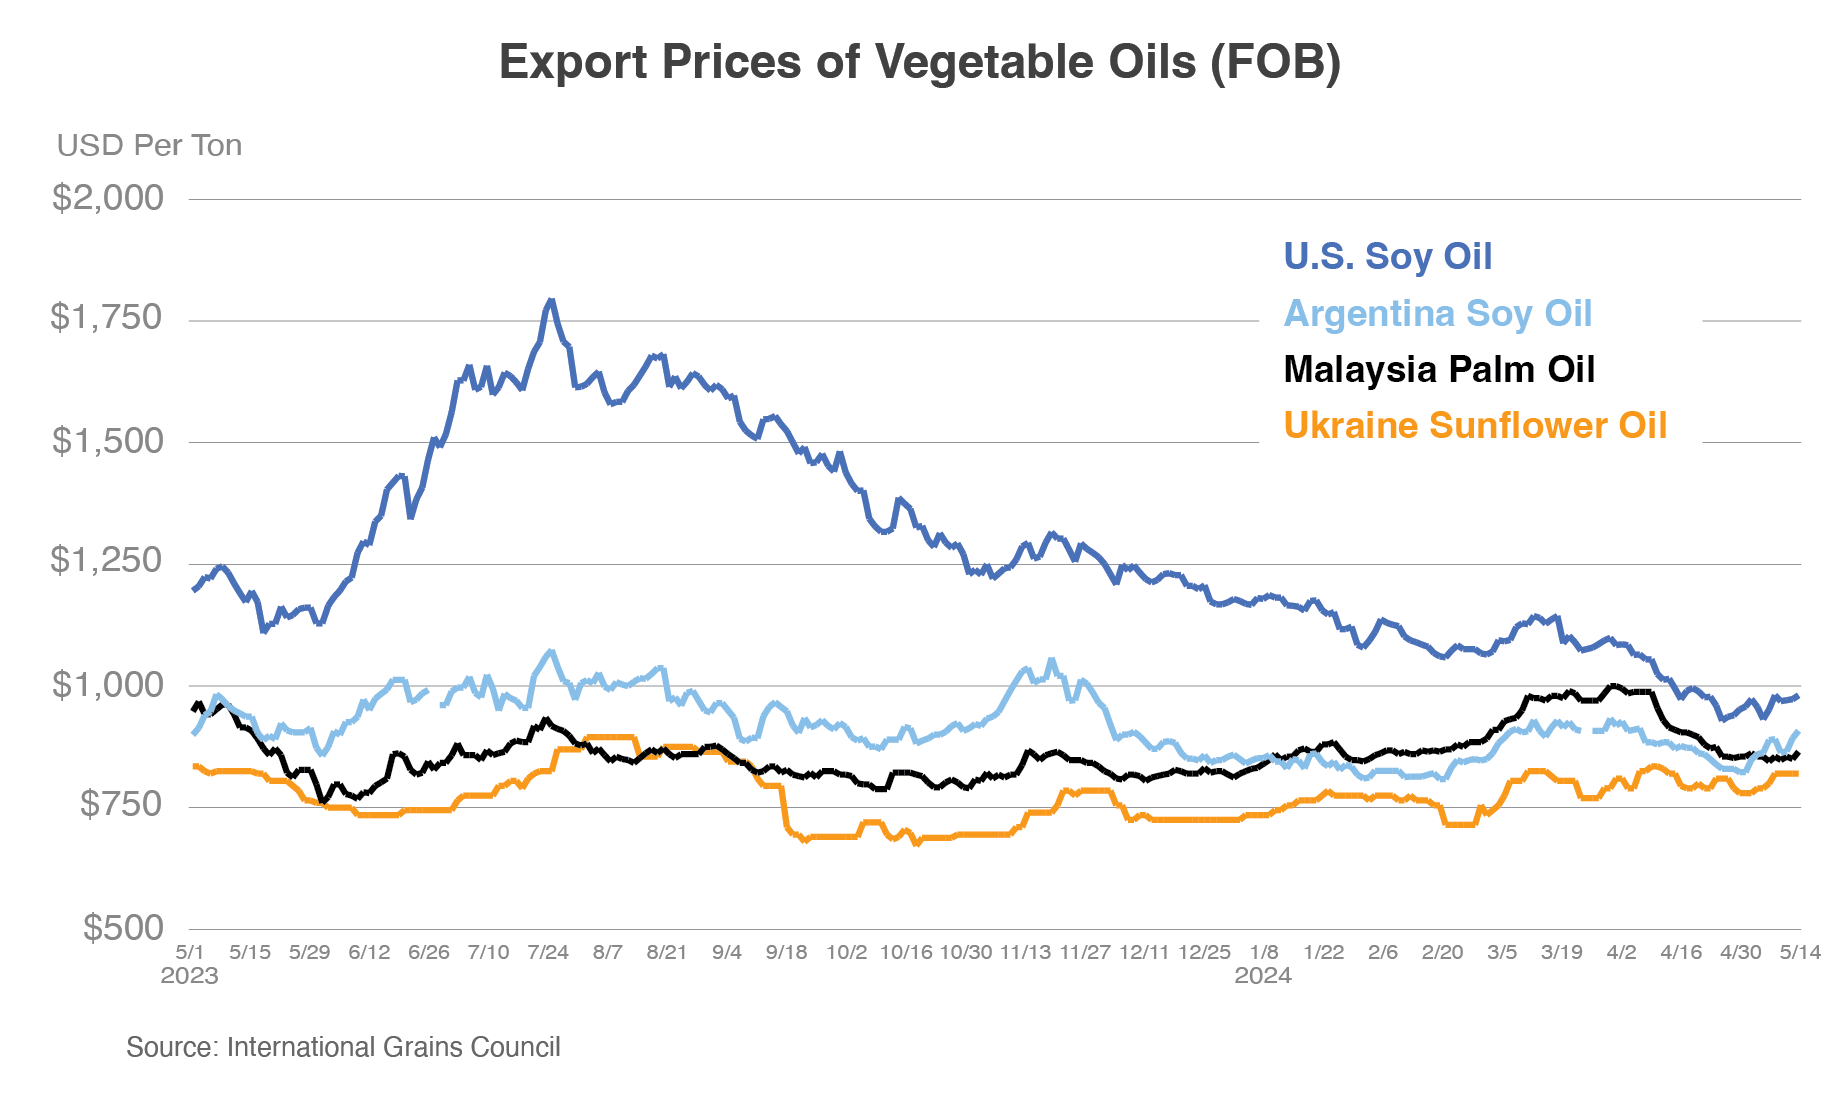
In early 2024, however, U.S. soybean oil premiums began to narrow below the gap experienced during the past few years. Soybean oil was the crucial feedstock that allowed renewable diesel production to explode so rapidly and accounted for slightly less than half of biomass-based diesel feedstock usage by volume throughout 2022. Over the past year, however, soybean oil share of feedstocks has slowly trended downward, losing share to tallow and canola oil. With rising imports of lower carbon-intensity feedstocks and lower-cost Canadian canola oil, reliance on soybean oil for biomass-based diesel production has declined, and domestic prices are responding. If price premiums continue to fall, U.S. soybean oil exports could recover slightly. Forecasted 2024/25 U.S. soybean oil exports are up marginally but remain well-below historical volumes prior to the renewable diesel boom.
Higher Crush Supports Soybean Meal Export Gains
Robust growth in U.S. demand for soybean oil pushed soybean crush higher, leading to greater soybean meal supplies and record 2022/23 soybean meal exports. Greater supplies and higher exports are expected to continue as 2024/25 U.S. soybean meal exports are forecast at a record for the third consecutive year. Traditionally in the United States, soybean crush was driven by the demand for protein-rich soybean meal for feed rations. As a result, the subsequent oil produced was a secondary product to be consumed for food, used for biofuels and other industrial purposes, or exported. However, since the renewable diesel boom, high soybean oil prices are driving U.S. crush, leading to abundant soybean meal production. Since a typical soybean crush facility produces meal and oil in roughly a 4:1 ratio, the surplus of meal can accumulate rapidly as crush expands for oil. Additionally, soybean meal has a relatively short shelf-life, so supplies have a limited timeframe to be consumed, leading to abundant exportable supplies once the local demand is satisfied.
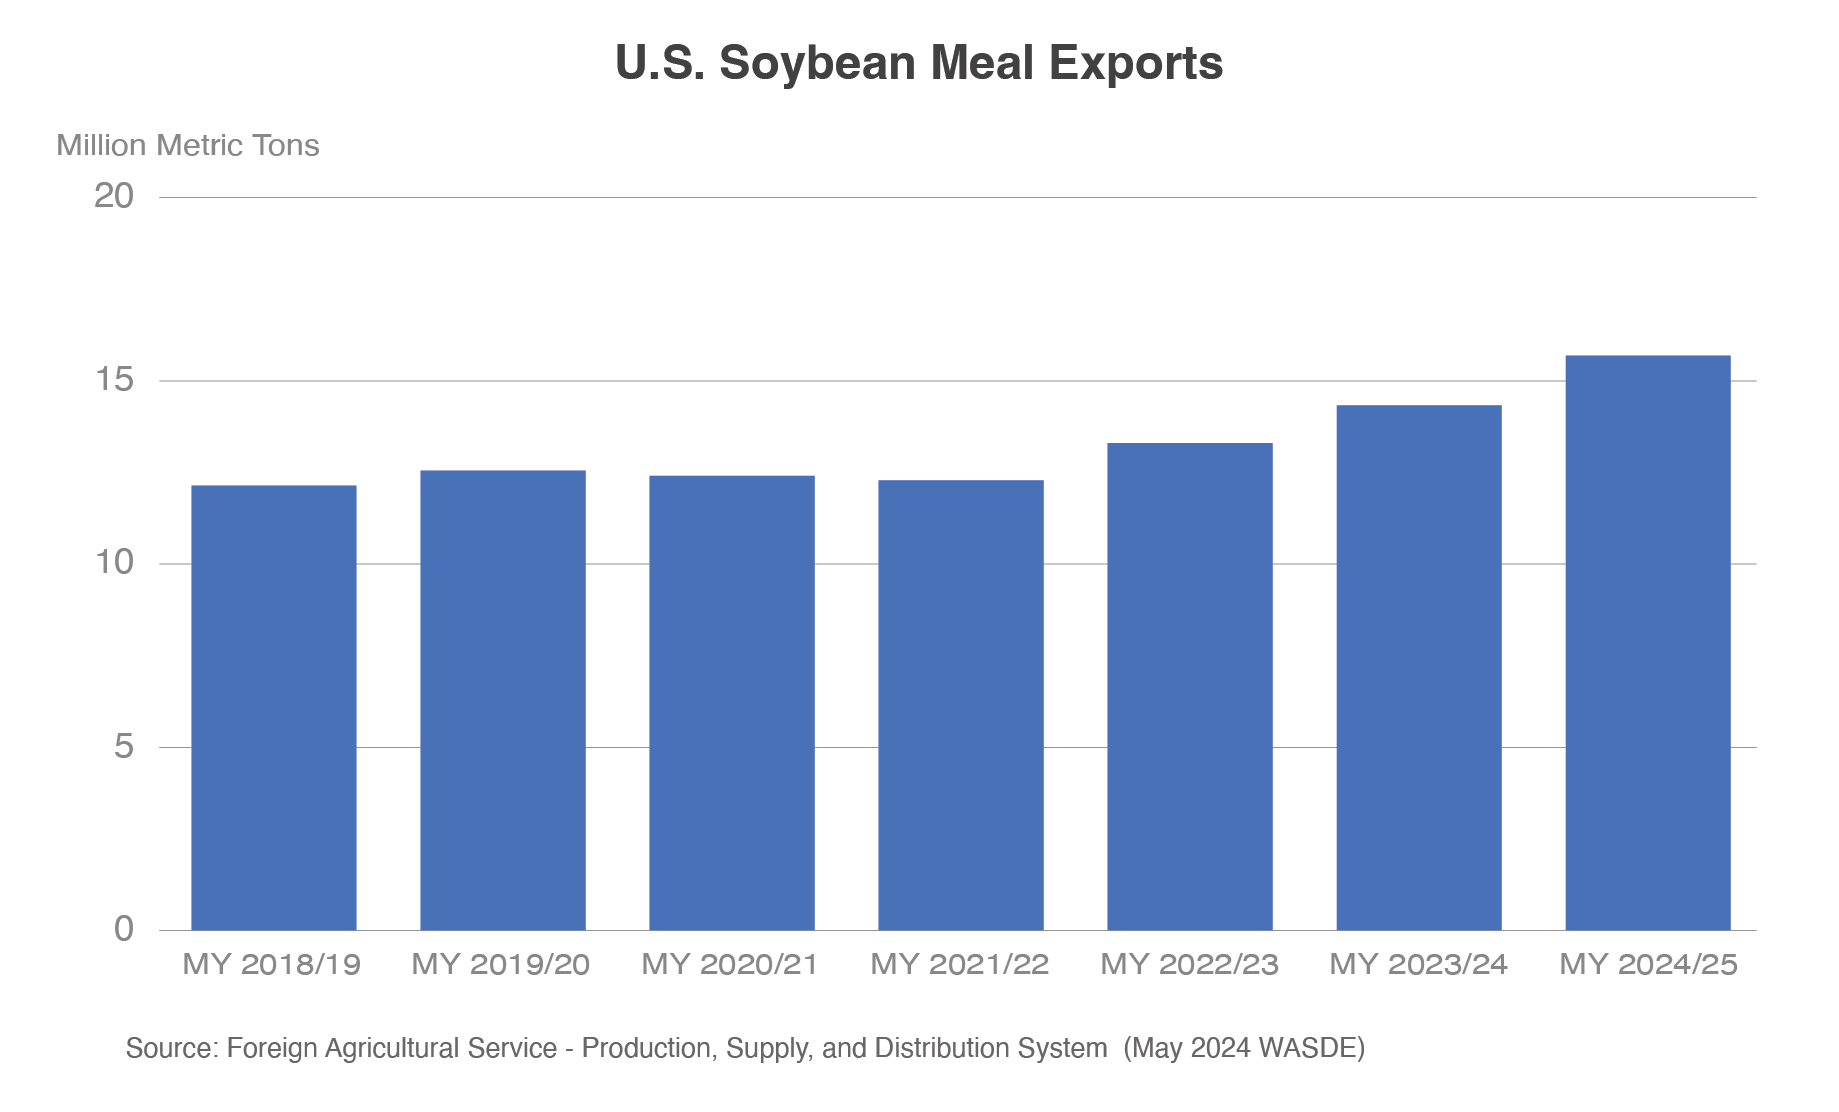
Prior to the renewable diesel expansion, the United States typically accounted for 18 percent of global soybean meal exports behind Brazil (25 percent) and Argentina (40 percent). However, the United States is expected to grow market share to 21 percent in 2024/25 owing to growth in exportable supplies. Starting in 2022/23, encouraged by higher crush demand, U.S. soybean meal exports grew eight percent. U.S. exports were also supported by the historic drought in Argentina, resulting in a 22-percent drop in production for the world’s largest soybean meal exporter. This both reduced competition for U.S. exports and boosted global prices. As a result, U.S. soybean meal export values in 2023 jumped 21 percent from the previous year’s record. The impacts of the drought continued to support U.S. soybean meal exports through the first half of 2023/24, as Argentine crush did not recover to pre-drought levels until March 2024.
The Future of U.S. Renewable Diesel and Trade Implications
As U.S. soybean crush and renewable diesel production continue to expand, the impacts described above should, for the most part, become more exaggerated. However, there are a few wildcards that could both heighten or dampen these shifts.
The main factor driving these changes is policy, namely the California LCFS and the RFS. As previously mentioned, the expansion of renewable diesel would not have happened without a policy incentive. Therefore, the mandates and incentives created by these policies will determine the rate of production growth in the coming years, which could end up being well below current and proposed capacities at refineries. Thus, biomass-based diesel production should continue growing based on current federal mandates, but both growth and the rate of growth will be highly dependent on future federal and state policies. Likewise, both imports of animal fats and vegetable oils should further expand, but feedstock availability could limit renewable diesel expansion and slow growth well-below proposed capacity expansion.
Coupled with growth in feedstock imports, U.S. soybean oil exports should continue feeling downward pressure as biomass-based diesel production soaks up domestic supplies and keeps prices less competitive than other suppliers and substitutable vegetable oils. Although, if supplies of less carbon-intense feedstocks like UCO and tallow are ample enough to fuel production growth, U.S. soybean oil price premiums should continue dissolving. U.S. soybean oil exports could experience a slight recovery at more competitive prices, but biomass-based diesel production should keep soybean oil exports well-below the historical average.
Another complex ripple effect from expanding renewable diesel production will be the impact on U.S. soybean meal production, consumption, and trade. During the past year, a large part of the growth in exports was due to reduced competition from Argentina after the drought. However, when Argentina production recovers to normal levels, there likely won’t be enough growth in global consumption for both expanding U.S. exports and a recovery in Argentine supplies.
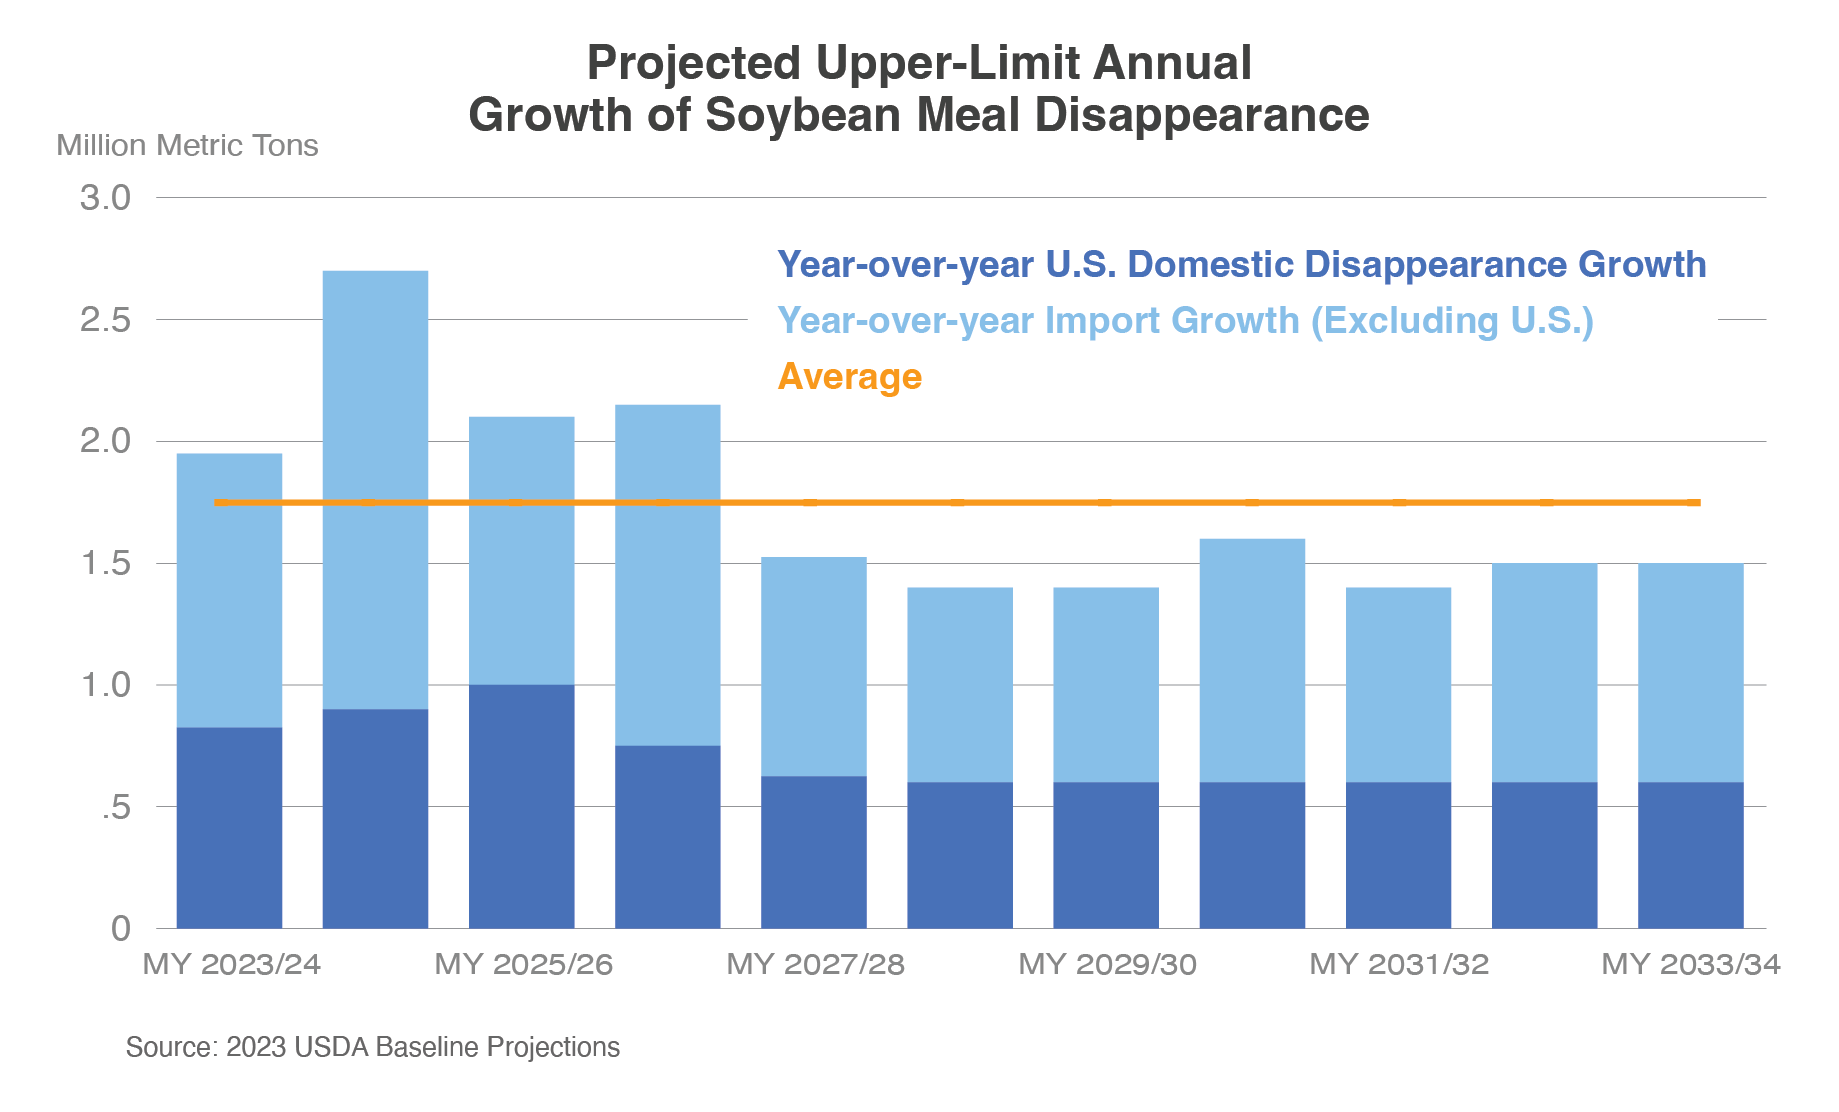
Even if the United States can capture all global soybean meal import growth, U.S. crush and renewable diesel growth could be limited by the ability to find an outlet for surplus soybean meal. According to the USDA 2023 baseline projections, U.S. soybean meal domestic disappearance is projected to grow by 0.7 million tons a year on average during the next decade. Likewise, global soybean meal imports are projected to grow by slightly more than 1.0 million tons each year. Assuming the United States captures all growth in global imports, it could produce and distribute an additional 1.7 million tons of soybean meal each year, which would equate to about 0.4 million tons of additional soybean oil per year. Growth in soybean oil consumed for biomass-based diesel, however, outpaced this amount in each of the past two years, at 0.6 million tons in 2022 and 1.1 million in 2023. Based on global demand for soybean meal, soybean oil cannot continue to fuel renewable diesel production growth at current rates during the next few years without major changes to global soybean meal demand, shifts in exporter market shares, or lower supplies in other exporting countries.
If the United States overproduces soybean meal, U.S. companies will export excess supplies in the short term instead of letting the product spoil in storage. In order to grow export volumes, U.S. traders will need to drop prices low enough to encourage price-sensitive buyers to switch to U.S.-origin soybean meal. In the long run, however, if global soybean meal supplies outpace global consumption and the United States is not able to take market share from Argentina and Brazil, both crush and possibly renewable diesel production will be constrained by an inability to dispose of soybean meal.
Resources
- Gerveni, M., T. Hubbs and S. Irwin. “Overview of the Production Capacity of U.S. Renewable Diesel Plants for 2023 and Beyond.” farmdoc daily (13):57, Department of Agricultural and Consumer Economics, University of Illinois at Urbana-Champaign, March 29, 2023. Permalink.
- Gerveni, M., T. Hubbs and S. Irwin. “Renewable Diesel Boom Archives, 16 articles.” FarmDoc Daily, Department of Agricultural and Consumer Economics, University of Illinois at Urbana-Champaign. 8 February 2023 – 17 January 2024. Web Page.
- Kingsbury, Agata. “Biodiesel Policies Suppress U.S. Soybean Oil Exports.” Oilseeds: World Markets and Trade, October, 2023. Web Page.
- Martin, Jeremy. “Everything You Wanted to Know About Biodiesel and Renewable Diesel. Charts and Graphs Included.” The Equation, 10 January 2024. Web Page.
- Bukowski, M., & Swearingen, B. (2023). Oil crops outlook: December 2023 (Report No. OCS-23l). U.S. Department of Agriculture, Economic Research Service.
Originally shared by USDA, June 11, 2024. Title updated for clarity and purpose, August 9, 2024.