

The growth of renewable diesel production capacity in the U.S. was dramatic in recent years, with capacity in just the last two years expanding by 1.8 billion gallons, or 225 percent (farmdoc daily, March 8, 2023). One of the most discussed and debated aspects of the renewable diesel boom is its impact on feedstock markets, such as soybean oil. In an earlier farmdoc daily article (May 1, 2023), we examined historical feedstock usage trends for the combined total of renewable diesel and biodiesel over 2011 through 2022. In order to gain a more complete picture of feedstock usage trends, it is useful to break out usage trends for biodiesel and renewable diesel separately. The purpose of today’s article is to estimate feedstock usage trends for biodiesel over 2011 through 2022. This is the 11th in a series of farmdoc daily articles on the renewable diesel boom (see the complete list of articles here).
Analysis
The two main types of biomass-based diesel (BBD) fuels used to comply with the U.S. Renewable Fuel (RFS) mandates are “renewable diesel” and “FAME biodiesel.” Although renewable diesel and FAME biodiesel are produced with the same organic oils and fats feedstocks, their production process differs substantially, resulting in the creation of two fundamentally different fuels (for details see farmdoc daily, February 8, 2023).
Table 1 lists the most common organic oils and fats feedstocks used to produce FAME biodiesel. The first group consists of vegetable oils that are produced by crushing vegetable seeds, such as soybeans and canola. The second group consists of animal fats that are by-products of slaughtering animals. Yellow grease is a unique type of feedstock because it can be made up of various kinds of fats and oils. A key component of yellow grease is used cooking oil; hence, the category “waste fats and oils.” It is not hard to grasp the diversity of fats and oils in yellow grease when one thinks about all the different vegetable oils and animal fats that are used for cooking in retail food businesses. This makes yellow grease something of a catch-all type of feedstock. Lastly, it is important to note that the list of feedstocks in Table 1 is by no means exhaustive.

Following our previous farmdoc daily article (May 1, 2023), we begin by estimating total feedstock usage for FAME biodiesel. This is based on benchmark estimates of the pounds of feedstock used per gallon in the production of FAME biodiesel. A farmdoc daily article (February 16, 2022) reports that an average of 7.55 pounds of feedstock is used to produce one gallon of biodiesel. Therefore, we multiply EIA estimates of monthly renewable diesel production by 7.55 to imply total biodiesel feedstock usage. The monthly production estimates are published by the EIA in its monthly Monthly Energy Review over January 2011 through December 2022. We then aggregate to the annual level by summing the monthly feedstock estimates for a calendar year.
Figure 1 presents our annual estimates of implied total feedstock usage over 2011 through 2022 for FAME biodiesel. The chart highlights the substantial increase in feedstock usage that occurred over 2011 through 2018, which nearly doubled from 7.3 to 14.0 billion pounds. After peaking in 2018, biodiesel feedstock used began to decline, falling back to 12.3 billion pounds in 2022. The decline is undoubtably related to competitive pressures from booming renewable diesel production, especially since 2021.

The next step of the analysis is to allocate the total feedstock volumes in Figure 1 to the different types of biodiesel feedstocks. This is straightforward to do from 2011 through 2020, since the Monthly Biodiesel Production Report from the EIA contained survey estimates of individual feedstock usage for FAME biodiesel. We use these estimates directly for 2011 through 2020, the same assumption as in our previous article on biomass-based diesel feedstock trends (farmdoc daily, May 1, 2023). One issue is that the EIA biodiesel feedstock estimates for a given year usually sum to less than the total biodiesel feedstock estimates presented in Figure 1. We account for this small difference by simply adding the difference to the “other” category in the biodiesel feedstock estimates found in the EIA report. In this way, feedstock usage estimates for individual categories are forced to add up to the total implied FAME biodiesel feedstock estimates shown in Figure 1.
Due to the growth of renewable diesel production, the Monthly Biodiesel Production report was discontinued after December 2020, and it was replaced by a new EIA report called the Monthly Biofuels Capacity and Feedstocks Update, which initially only included monthly survey estimates of feedstock usage for biomass-based diesel (the combined total of renewable diesel and FAME biodiesel feedstock usage). The EIA modified this report and started reporting soybean oil feedstock usage broken out by renewable diesel and biodiesel starting in January 2022. Consequently, EIA monthly estimates of soybean oil feedstock usage in 2022 are used as reported.
In order to estimate all categories of FAME feedstock usage in 2021 and non-soybean oil feedstock usage in 2022, we take advantage of the stability in feedstock percentage shares derived from EIA survey estimates over 2011 through 2020. Figure 2 presents the monthly shares for six major categories of FAME biodiesel feedstock over January 2011 through December 2020. While there is some variation in the shares, the overall impression is that the shares depart relatively little from average levels. For example, the average soybean oil share over this period is 55.2 percent, and the vast majority of the time it moved in a narrow range between 50 and 60 percent. The peak above 70 percent in the spring of 2020 was due to the closure of retail food establishments and slaughtering plants that temporarily limited the availability of other feedstocks during the early phases of the COVID pandemic.

A question that naturally arises is the best procedure for projecting the percentage shares in Figure 2 into the future. The simplest would be to use the average percentage shares over 2011 through 2020. However, this would ignore the information provided by EIA soybean oil feedstock usage estimates in 2022. Instead, we search for the averaging window that provides the most accurate estimate of actual soybean oil feedstock usage in 2022. This turns out to be the six-year average over 2015-2020. Based on this result, we estimate all monthly FAME biodiesel feedstock category volumes in 2021 and non-soybean oil categories in 2022 as the six-year average percentage shares times total implied FAME biodiesel feedstock volume for that same month.
We note that the EIA began releasing the breakout between biodiesel and renewable diesel feedstock usage for canola starting in July 2023. This will be extended to corn oil at some point in the future. The additional data will help improve the accuracy of FAME biodiesel feedstock usage estimates in the future.
The projection method outlined above creates a relatively minor adding up issue in 2022. The reason is that we use the actual volume of soybean oil feedstock usage for biodiesel for all months in 2022 rather than estimates based on the above projection method. As a result, the total of non-soybean oil and soybean oil feedstocks is not guaranteed to sum to the total implied biodiesel feedstock for the given month (again, only for 2022). We compute this difference and allocate it across all non-soybean oil feedstock categories based on the six-year percentage shares used to originally project volumes for these categories. In this way, feedstock usage estimates over for non-soybean oil and soybean oil categories in 2022 are forced to add up to the total implied FAME biodiesel feedstock estimates shown in Figure 1.

Figure 3 presents our annual estimates of the allocation of total implied FAME biodiesel feedstock volumes to individual feedstocks over 2011 through 2022. Note that the height of each bar in Figure 3 is the same as in Figure 1. The only difference is that total feedstock usage is allocated by feedstock type in Figure 3. Not surprisingly, the estimates show a stable pattern of feedstock usage, with soybean oil the largest source of FAME biodiesel feedstock in each year. Soybean oil usage peaked in 2020 at 8.6 billion pounds, and then fell back to 7.1 billion pounds in 2022. In most years, the next two largest feedstocks were corn oil and yellow grease.
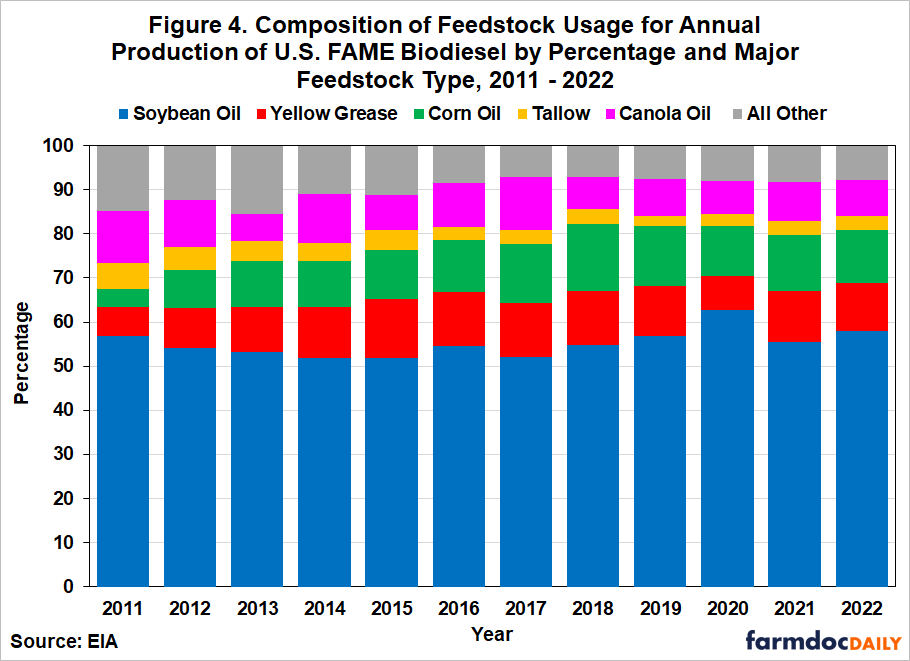
Figure 4 presents the allocation of feedstock usage in percentage terms to provide direct evidence on annual market shares. Two observations stand out based on this chart. The first is the dominance of soybean oil as a feedstock for FAME biodiesel production. In every year over 2011 through 2022, soybean oil represented a majority of biodiesel feedstock usage, with an average share of 55.2 percent. The next largest category was corn oil, with an average of 11.2 percent. The second is the stability of the percentage feedstock shares over time. One way of illustrating this is the fact that the standard deviation of the feedstock shares only ranged between about one and three percent. Finally, while it is true that total biodiesel feedstock usage declined during the renewable diesel boom that started in 2021, neither the dominance of soybean oil nor the stability of feedstock shares has been materially impacted.
Implications
This article examines trends in feedstock usage for FAME biodiesel in the U.S. over 2011 through 2022. Total biodiesel feedstock usage increased substantially over 2011 through 2018, nearly doubling from 7.3 to 14.0 billion pounds. After peaking in 2018, biodiesel feedstock use began to decline, falling back to 12.3 billion pounds in 2022. In terms of individual feedstocks, soybean oil was dominant every year over 2011 through 2022, with an average share of 55.2 percent. The next largest category was corn oil, with an average share of 11.2 percent. Percentage shares for all categories of feedstock were quite stable over time. It is interesting to note that neither the dominance of soybean oil nor the stability of feedstock shares was materially impacted by the renewable diesel boom that began in earnest during 2021.
The next article in this series will examine trends in feedstock usage for renewable diesel.
1The findings and conclusions in this publication are those of the authors and should not be construed to represent any official USDA or U.S. Government determination or policy. This work was supported in part by the U.S. Department of Agriculture, Economic Research Service.
References
- Gerveni, M., T. Hubbs and S. Irwin. “Renewable Diesel and Biodiesel Feedstock Trends over 2011–2022.” farmdoc daily (13):80, Department of Agricultural and Consumer Economics, University of Illinois at Urbana-Champaign, May 1, 2023.
- Gerveni, M., T. Hubbs and S. Irwin. “Overview of the Production Capacity of U.S. Renewable Diesel Plants through December 2022.” farmdoc daily (13):42, Department of Agricultural and Consumer Economics, University of Illinois at Urbana-Champaign, March 8, 2023.
- Gerveni, M., T. Hubbs and S. Irwin. “FAME Biodiesel and Renewable Diesel: What’s the Difference?” farmdoc daily (13):22, Department of Agricultural and Consumer Economics, University of Illinois at Urbana-Champaign, February 8, 2023.
- Irwin, S. “2021 Was a Devastating Year for Biodiesel Production Profits.” farmdoc daily (12):21, Department of Agricultural and Consumer Economics, University of Illinois at Urbana-Champaign, February 16, 2022.
Originally shared by FarmDoc Daily. Gerveni, M., T. Hubbs and S. Irwin. “Biodiesel Feedstock Trends over 2011-2022.” farmdoc daily (13):224, Department of Agricultural and Consumer Economics, University of Illinois at Urbana-Champaign, December 11, 2023.